Research Theme
4.Protonation and charged states of amino-acid residues and ionsin the
transmembrane region of an ion pumpanalyzed by electron crystallography of thin 3D crystals
Koji Yonekura
Biostructural Mechanism Laboratory, RIKEN SPring-8 Center
Membrane proteins and biological macromolecular complexes often yield crystals too small or too thin for even the modern synchrotron X-ray beam and X-ray free electron laser. Electron crystallography could provide a powerful means for structure determination with such undersized crystals, as protein atoms diffract electrons 4 - 5 orders of magnitude more strongly than they do X-rays. Furthermore, as electron crystallography yields Coulomb potential maps rather than electron density maps, it could provide a unique method to visualize the charged states of amino acid residues and metals. We have developed a methodology for electron crystallography of ultra-thin (only a few layers thick) 3D protein crystals and present the Coulomb potential map of Ca2+-ATPase at 3.4 Å resolution [1].
Coulomb potential maps around the Ca2+-binding sites in the transmembrane region, calculated from 8 - 3.4 Å (Figs. 1a and b) or 5 - 3.4 Å resolution data (Fig. 1c), show well resolved side chains but different features. For instance, the density for the carboxyl group of Asp 800 is absent in the 8 - 3.4 Å resolution map (Figs. 1a and b), but present in the 5 - 3.4 Å resolution map (Fig. 1c). This is the expected behavior of a negatively charged residue according to the theoretical maps, as the atomic scattering factors of negatively charged atoms show negative values blow 5 Å resolution [1].
As many acidic residues cluster to form the transmembrane Ca2+-binding sites, the pKas of the carboxyl groups may be highly perturbed. The maps for Glu 908, expected to be protonated to form a hydrogen bond with Glu 771, show distinctly different behavior, displaying positive density at the carboxyl group in both 8 - 3.4 Å and 5 - 3.4 Å resolution maps. Furthermore, the |Fobs| - |Fcalc| map calculated from 8 - 3.4 Å resolution data shows a well-defined positive peak of 3.8σ at the oxygen atom closer to Glu 771 (Fig. 1a), if a negatively charged carboxyl is assumed. The experimental map is well explained if the Glu 908 carboxyl has no charge (Fig. 1b). These observations provide experimental support for electrostatic calculations that indicate that the Glu908 side chain is protonated. Composite omit maps also show consistent features for both Asp 800 and Glu 908 [1].
The Coulomb potential map should also be able to distinguish the charge of bound calcium. Although the appearance of the map does not change much, if no charge for the bound calcium is assumed, the |Fobs| - |Fcalc| map exhibits large positive densities around the two Ca atoms (purple nets in Fig. 1b), indicating that both bound calciums are indeed positively charged.
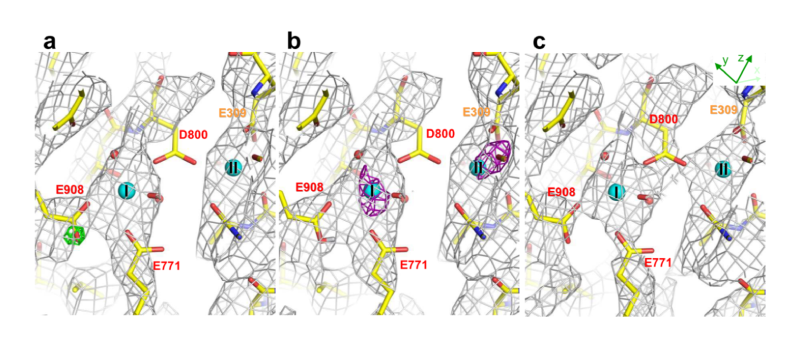 Fig. 1. Coulomb potential (σA-weighted 2|Fobs| - |Fcalc|) maps around the Ca2+-binding sites, contoured at 1σ and superimposed on the atomic model. (a) Calculated from 8 - 3.4 Å resolution data with a difference (σA-weighted |Fobs| - |Fcalc|) map (green; contoured at 3.5σ) overlaid. (b) The same as in (a), but calculated with Glu 908 protonated. No significant difference is observed in the density map around Glu 908. If the structure factor for neutral Ca is used, two large positive peaks of 4.3σ and 4.5σ appear at sites I and II, respectively, in the difference (|Fobs| - |Fcalc|) map (purple nets in c, contoured at 3.5σ). (c) Calculated from 5 - 3.4 Å resolution data.
【References】
[1] K. Yonekura, K. Kato, M. Ogasawara, M. Tomita and C. Toyoshima: “Electron crystallography of ultra-thin 3D protein crystals: atomic model with charges”, Proc. Natl. Acad. Sci. USA, 112, 3368-3373 (2015).