Research Theme
3.Changes in lipid metabolism during differentiation pathway of mammalian cells
Sota Takanezawa, Yasushi Sako
Cellular Informatics Laboratory, RIKEN
Cell fates change dynamically in response to various extracellular signals, including growth factors that stimulate differentiation and proliferation. The processes underlying cell fate decisions are complex and often include large cell-to-cell variations, even within a clonal population in the same environment. To understand the origins of these cell-to-cell variations, we must detect the internal dynamics of single cells that reflect the changing chemical milieu inside single cells. In this study, we used the Raman spectra of single cells to trace their internal dynamics during the early stages of growth factor stimulation. This method allows nondestructive and inclusive time-series analyses of the chemical compositions of the same single cells.
Applying a Gaussian mixture model to the major principal components of the single-cell Raman spectra, we detected the dynamics of the chemical states in MCF-7 cancer-derived cells in the absence and presence of differentiation and proliferation factors. The dynamics displayed characteristic variations according to the functions of the growth factors. In the differentiation pathway, the chemical composition changed directionally between multiple states, including both reversible and irreversible state transitions. In contrast, in the proliferation pathway, the chemical composition was homogenized into a single state. The differentiation factor also stimulated the fluctuations in the chemical composition, whereas the proliferation factor did not.
Raman measurements of single living cells
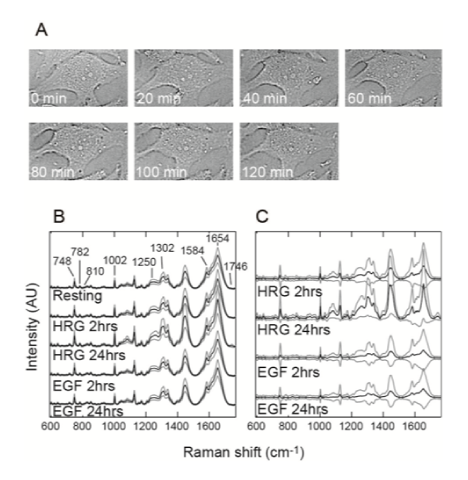
(A) Transmission-illumination micrographs of a single MCF-7 cell just after the Raman measurements made at the indicated times. No significant changes were observed in the cell morphology.
(B) Averaged Raman spectra from the cytoplasm of cells under the indicated conditions. Positions of the major Raman bands derived from proteins (1002, 1250, and 1654 cm–1), cyt c (748 and 1584 cm–1), lipids (1302, 1654, and 1746 cm–1), and nucleic acids (782 and 810 cm–1) are indicated. (C) The difference spectra against the averaged spectrum in the resting condition. The black and gray lines in (B) and (C) indicate the average and width of the standard deviations, respectively. AU: arbitrary units.
【References】
[1] S. Takanezawa, S. Morita, Y. Ozaki, and Y. Sako , Biophys. J. 108, 2148-2157 (2015).
[2] S. Morita, S. Takanezawa, M. Hiroshima, T. Mitsui, Y. Ozaki, and Y. Sako, Biophys. J., 107, 2840-2848 (2014).